How to Read a Fall Color Foliage Map (What Nobody Tells You)
- joshua25104
- Apr 21
- 16 min read

A fall color foliage map is a geographic visualization tool that shows the current or predicted stage of autumn leaf color change across a region, using color-coded categories to indicate how close a given area is to peak foliage. Most national maps update daily or weekly based on ground reports, satellite data, and historical temperature models. But here is what nobody explains: knowing how to read and apply that map accurately is more valuable than the map itself.
Peak foliage in any location typically lasts only 7 to 10 days, making accurate timing critical for planning a successful trip.
National foliage maps use 6 to 7 color-coded stages; knowing what each stage means practically (not just visually) determines whether you arrive at peak or miss it by a week.
Maps carry a meaningful margin of error because elevation, microclimate, and species composition all shift local timing by days or weeks within the same county.
Combining a foliage map with a weather forecast tool and a frost-date calendar dramatically improves your trip accuracy, a practice almost no guide explains.
As of 2026, several mobile apps offer push notifications for foliage stage updates, which solves the problem of monitoring fast-moving peak windows while planning from home.
Colorado's golden aspens, including those visible from trails near Boulder, peak in late September to early October, making the Front Range one of the most reliably timed foliage destinations in the western U.S.
Most foliage guides hand you a map and tell you to plan your trip. Few explain that a single fall color foliage map is a probability estimate, not a live camera feed. The predictions are built from historical averages, volunteer ground reports, and temperature modeling. They are genuinely useful starting points. But they require interpretation, and that interpretation separates the travelers who arrive at a hillside blanketed in color from those who show up to bare branches a week too late.
This guide covers the full process: how to decode what each color stage actually means on the ground, which tools to combine for a smarter trip decision, where the maps consistently fall short, and how Boulder-area foliage fits into the national picture. Whether you are driving the Blue Ridge Parkway or hiking through Rocky Mountain National Park, the same framework applies.
What Do the Color Stages on a Foliage Map Actually Mean?
Fall foliage map color stages refer to the percentage of leaves in a given area that have changed color or dropped. Most major national maps use either a 6-stage or 7-stage scale, but the labels vary between platforms, which creates confusion when comparing sources. Understanding the practical field definition of each stage tells you whether you should book a trip immediately or wait another week.
The ExploreFall.com national forecast, powered by Esri mapping technology and updated daily, uses six stages: Little to No Color, Low Color, Moderate Color, High Color, Peak Color, and Past Peak. The Smoky Mountains fall foliage prediction map uses seven stages: No Change, Minimal, Patchy, Partial, Near Peak, Peak, and Past Peak. The differences are subtle but matter when cross-referencing tools.
Here is what each meaningful stage looks like on the ground:
Stage | What You See in the Field | Trip Timing Advice |
Little to No Color / No Change | Fully green canopy; no visible change | Too early; wait 2-4 weeks depending on latitude |
Low / Minimal / Patchy | Scattered yellow or orange leaves; mostly green | Early; best for photographers who want green-gold contrast |
Moderate / Partial | 30-60% color change; canopy a mix of green and fall tones | Good for hiking; color is building and visually interesting |
High / Near Peak | 60-80% color change; vivid and varied palette | Excellent window; often underrated and less crowded than Peak |
Peak | 80-100% color change; maximum vibrancy | Book immediately; this window lasts 7-10 days |
Past Peak | Leaves dropping; muted or bare canopy | Avoid unless traveling for early-season lower-elevation color |
One thing worth knowing: Near Peak or High Color is often the sweet spot for actually enjoying the landscape. Peak weekend crowds at destinations like Acadia National Park or the Blue Ridge Parkway can be intense enough to undermine the experience. Arriving 3-5 days before projected peak gives you excellent color, lighter traffic, and more flexibility on where to hike or park.
Why Fall Foliage Maps Are Estimates, Not Forecasts (The Limitations Nobody Mentions)
Fall foliage maps are probability models based on historical averages and volunteer reports, not real-time satellite measurements of every forest. This distinction matters enormously when you are booking flights or reserving a cabin weeks in advance. Every major foliage map carries inherent limitations that the platforms themselves rarely explain prominently, and understanding those limitations helps you use the tools more effectively.
Specifically, three factors cause even a well-maintained foliage map to mislead:
Elevation Shifts Peak by 1-2 Weeks Within a Single County
A county-level map polygon might show "High Color" for a region, but the valley floor at 5,000 feet and the ridge at 10,000 feet could be two weeks apart in timing. In Colorado's Front Range, for example, aspen groves above 9,500 feet often peak in mid-September while lower-elevation stands near Boulder finish in early October. A single map color cannot capture that range. When planning a specific hike or drive, look for elevation-specific notes from the Minnesota DNR Fall Color Finder model, which shows historical progression with a date slider, or search for state-level park reports that break data down by trail elevation.
Microclimates Create Hyper-Local Variation
South-facing slopes dry out faster and often peak earlier than north-facing slopes in the same forest. Urban heat islands delay color in cities. Canyon bottoms trap cold air and accelerate the process. These microclimatic differences can shift peak timing by several days within a single park. No national foliage map operates at a resolution fine enough to reflect these differences. The Old Farmer's Almanac acknowledges in its foliage content that predictions can vary by several days even within a single state.
Drought and Unusual Warmth Compress or Destroy the Window
Prolonged drought causes early leaf drop before full color develops, producing a dull bronze-brown result instead of vivid reds and oranges. An unusually warm October can delay color change by a week, then strong winds strip the leaves in 48 hours. Neither of these scenarios appears reliably in a standard foliage map prediction. For 2026 trips, check the National Weather Service short-range forecast for wind advisories during your target peak window. Strong winds in late fall can result in prematurely bare trees regardless of what the foliage map shows.
Step 1: Choose the Right Foliage Map for Your Trip
Selecting the right fall color foliage map means matching the tool's resolution and update frequency to your specific planning need. National maps work well for broad regional comparison; state-level and park-specific maps are more accurate for day-trip or destination planning. Using only one map is the most common planning mistake.
Start with a national map for big-picture timing, then drill down to a state or park-level source for specifics. Here are the most useful tools available in 2026:
ExploreFall.com: The most comprehensive national option, updated daily using Esri GIS technology and hundreds of on-the-ground reports. Use it first to identify which regions are approaching peak in any given week.
Smoky Mountains Foliage Map (smokymountains.com): Strong for the eastern U.S., especially the Southeast and Appalachians. Its 7-stage scale adds nuance for destinations like Gatlinburg, where the foliage window from Clingmans Dome (early October) to lower elevations (early November) spans nearly six weeks.
Minnesota DNR Fall Color Finder: The gold standard for state-level data. If your trip targets the upper Midwest, this government-run tool includes a historical slider, photo gallery, and a text subscription service (text FALL to 66468 for weekly updates).
State park and forest service websites: Most state parks that draw significant leaf-peeping traffic publish weekly foliage reports during September and October. For destinations like Acadia National Park in Maine or Cuyahoga Valley National Park in Ohio, these reports are more precise than any national map.
For mobile use, ExploreFall.com functions well on mobile browsers and is one of the few major foliage tools that has invested in mobile-optimized display. If you are driving through areas with poor cell service on routes like the Blue Ridge Parkway or Kancamagus Highway in New Hampshire, download offline maps beforehand using Google Maps or Gaia GPS for your route. Foliage stage accuracy matters less when you cannot load the map at all.
Step 2: Cross-Reference the Map with Weather Data
Cross-referencing a fall color foliage map with weather forecast data is the single most underused planning technique for leaf-peeping trips. Two weather conditions most directly determine whether your peak window is vibrant, compressed, or ruined: overnight temperatures in the low 40s Fahrenheit (which accelerate anthocyanin production and deepen red coloration) and wind speed during the peak window (which strips leaves before you arrive).
The science behind this is well-established. According to SUNY College of Environmental Science and Forestry (ESF), the two primary factors controlling fall foliage timing are daylight length and temperature. Daylight hours trigger the tree's physiological response; temperature determines the speed and intensity of color development. Specifically, cool nights followed by warm sunny days produce the most vivid red and orange coloration because anthocyanins accumulate rapidly in those conditions.
Three weather checks to make before finalizing travel dates:
Overnight lows: Look for a stretch of nights in the 38-45°F range at your destination's elevation. This is the ideal anthocyanin-building window. A warm stretch (nights above 55°F) will delay and mute color.
Wind forecast: Check the 7-day wind forecast for your specific dates. Wind events above 25-30 mph during peak can strip a hillside in a day or two. If a windstorm is forecast for your peak weekend, consider shifting arrival one to two days earlier.
Overcast vs. clear skies: Counter-intuitively, a lightly overcast day often makes fall colors appear more vivid than harsh direct sunlight, because diffuse light reduces glare and lets the full color spectrum of each leaf register. ESF's research supports this. For photography specifically, cloudy-bright days beat direct midday sun.
Combine the National Weather Service 7-day forecast with your foliage map check in the two weeks before your trip. This two-source approach is far more reliable than relying on either tool alone.
Step 3: Match Regional Peak Timing to Your Travel Window
Regional peak timing for fall foliage follows a predictable north-to-south, high-elevation-to-low-elevation progression across the United States each year, making it possible to plan a trip weeks or months in advance using historical patterns as a starting framework. The timing below represents historical averages; actual peak in any given year can shift by one to two weeks depending on summer heat and early autumn temperatures.
Region / Destination | Typical Peak Window | Best Viewing Spots |
Northern Alaska | Late August | Denali area tundra |
Northern Vermont, NH (Green Mountain Byway, Kancamagus Highway) | Early October | Stowe, Smugglers' Notch, Sabbaday Falls |
Adirondack Mountains, NY | Early October | High Peaks Scenic Byway, Lake Placid |
Colorado / Wyoming Golden Aspens (Rocky Mountain NP, Grand Teton) | Late September to Early October | Oxbow Bend, Moose-Wilson Road, Trail Ridge Road |
Black Hills, SD | Late September | Needles Highway, Spearfish Canyon |
The Berkshires, MA | Late September to Mid-October | Mohawk Trail, Mount Greylock |
New York, PA, MA (Catskills, Poconos) | Early to Mid-October | Kaaterskill Falls, Route 23A, Bushkill Falls |
Blue Ridge Parkway (VA & NC) | Late September to Late October | Mileposts 355-469, Linn Cove Viaduct |
Midwest: Door County WI, Traverse City MI, Cuyahoga Valley OH | Mid-October | Peninsula State Park, M-22 Drive, Brandywine Falls |
Smoky Mountains, TN | Early October to Early November | Clingmans Dome, Newfound Gap |
Ozark Mountains, AR | Late October | Scenic Byway 7, Ozark National Forest |
Southern states (Georgia, Kentucky) | Late October to Mid-November | Vogel State Park, Buckhorn Lake |
For Colorado specifically: golden aspen groves in Rocky Mountain National Park, the San Juan Mountains, and the foothills west of Boulder typically peak in late September. According to the Old Farmer's Almanac, by October 4th, some northern high-elevation areas will already be past their prime. If you are planning a Boulder-area foliage trip, target the last week of September and plan for the possibility of color arriving 5-7 days earlier or later depending on summer temperatures.
New England draws approximately 10 million visitors each year for fall foliage, according to widely cited regional tourism data, which means popular destinations like Kancamagus Highway and Acadia National Park are genuinely crowded during peak weeks. Factor in travel logistics and book lodging as early as possible if your dates land in the first two weeks of October for the Northeast.
Step 4: Account for What Foliage Maps Cannot Show You
The deepest limitation of any fall color foliage map is that it shows regional averages, not individual forest conditions. Two factors completely invisible on standard national maps can make or break a specific day trip: species composition and recent disturbance events.
Species Composition Changes Everything
Sugar maples produce the most vivid scarlet and orange colors, and they dominate New England forests. Colorado aspens produce pure gold but no reds. Oak-dominant forests in the Midwest and South shift later and produce more rust-brown tones. A map showing "Peak Color" for western North Carolina may reflect a mosaic of species where some trees (sourwood, red maple) are brilliant while others (oaks) are still green. Knowing the dominant tree species in your specific destination tells you what color palette to expect and whether the timing aligns with your preferences.
Storm and Drought History This Season
A summer drought reduces sugar content in leaves, which limits anthocyanin production and dampens reds. A severe wind event the week before your visit can strip 30-40% of peak canopy in 48 hours. Neither of these events registers on a predictive foliage map. For 2026 trips, supplement your foliage map check with a quick scan of local hiking forums, state park social media accounts, or recent AllTrails reviews for your specific destination. Hikers who were there last weekend are more accurate than any model.
International Foliage: Beyond U.S. Maps
Most foliage map resources focus exclusively on North America, but autumn color is a major travel draw globally. Japan's koyo (fall foliage) season typically runs from late October in Hokkaido through mid-December in Kyoto, with the Japan Meteorological Corporation publishing annual regional predictions. Canada's Quebec Laurentians peak in late September to early October, often rivaling Vermont for intensity. Germany's Black Forest and Bavaria peak in October. ExploreFall.com's blog includes a brief section on global foliage, but dedicated trip planning to Japan or Europe requires country-specific resources rather than any U.S.-centric map.
Step 5: Use Mobile Tools and Push Notifications to Track Fast-Moving Peak Windows
Mobile fall foliage tracking tools refer to apps, text services, and browser-based tools optimized for smartphones that allow travelers to monitor foliage stage changes in real time rather than checking desktop maps manually. Given that peak foliage windows last only 7 to 10 days, real-time mobile alerts can be the difference between arriving at the right time and missing the window entirely.
In 2026, the most practical mobile options include:
Minnesota DNR text service: Text FALL to 66468 for weekly foliage condition updates during the season. This is specific to Minnesota but is the most established government-run push notification system for foliage in the U.S.
ExploreFall.com mobile browser: The site is mobile-responsive and bookmarking it for a daily 30-second check during the two weeks before your trip is the simplest way to monitor progress.
State tourism board newsletters: Vermont, New Hampshire, and Colorado all publish weekly foliage reports via email during September and October. Signing up before your trip provides reliable, curated updates without requiring you to monitor multiple maps.
Offline maps for dead zones: Download the specific corridor you plan to drive (Blue Ridge Parkway, Kancamagus Highway, Rocky Mountain National Park trails) via Google Maps or Gaia GPS before departure. Cell service on scenic mountain routes is unreliable, and arriving without offline navigation is a genuine problem if you are trying to find a specific overlook or trailhead.
One practical note: many of the most photogenic foliage corridors in the U.S. run through valleys and canyons where cell signal drops to zero for 20-40 mile stretches. Plan for this specifically, not as an afterthought.

The Science Behind Why Leaves Change Color
Leaf color change in autumn refers to a biological process triggered by decreasing daylight hours that causes trees to stop chlorophyll production, revealing underlying pigments and generating new ones. Understanding this process explains why map predictions vary from reality and why some years produce dramatically more vivid color than others.
Chlorophyll, which gives leaves their green color throughout the growing season, breaks down gradually over a month or two as days shorten. This degradation reveals two types of pigments that were present all along: carotenoids (which produce yellow and orange hues) and flavonols (which contribute additional yellow). Beta-carotene, a specific carotenoid, reflects both yellow and red light, which is why it produces orange coloration. These pigments are always in the leaf but masked by chlorophyll during the growing season.
Red coloration is different. Anthocyanins, which produce the most vivid scarlet and crimson tones in species like sugar maple and red maple, are newly manufactured in autumn rather than revealed. Anthocyanins increase dramatically during the leaf's senescence process, providing red color and, interestingly, prolonging leaf life on the tree. Their production depends heavily on sugar concentration in the leaf and on cool, bright conditions. This is why a warm, cloudy autumn produces dull foliage: insufficient sugar accumulation and reduced anthocyanin synthesis.
Trees also form a layer of new cells at the base of each leaf stem, called the abscission zone, that gradually seals off the leaf's vascular connection to the branch. This seal enables leaf drop and is the tree's mechanism for surviving winter by preventing water loss. Fallen leaves decompose into humus on the forest floor, acting as a nutrient-rich layer that feeds the tree again the following spring.
Planning Your Boulder-Area Fall Foliage Trip
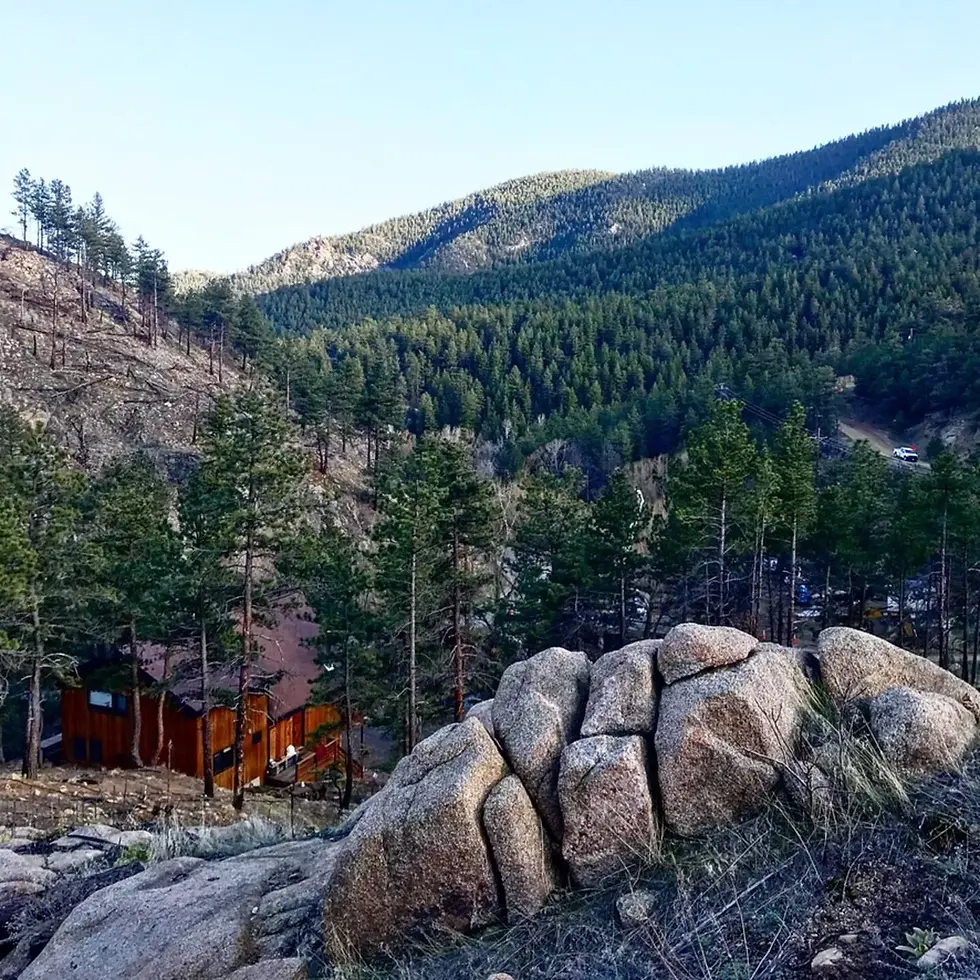
Boulder, Colorado sits at the foothills of the Rockies at roughly 5,430 feet elevation, placing it directly at the intersection of golden aspen country and the transition to lower-elevation mixed forests. This geographic position makes it one of the most accessible western U.S. foliage destinations, with multiple peak windows at different elevations reachable within a single day trip.
For the Boulder area specifically, the foliage calendar runs roughly like this:
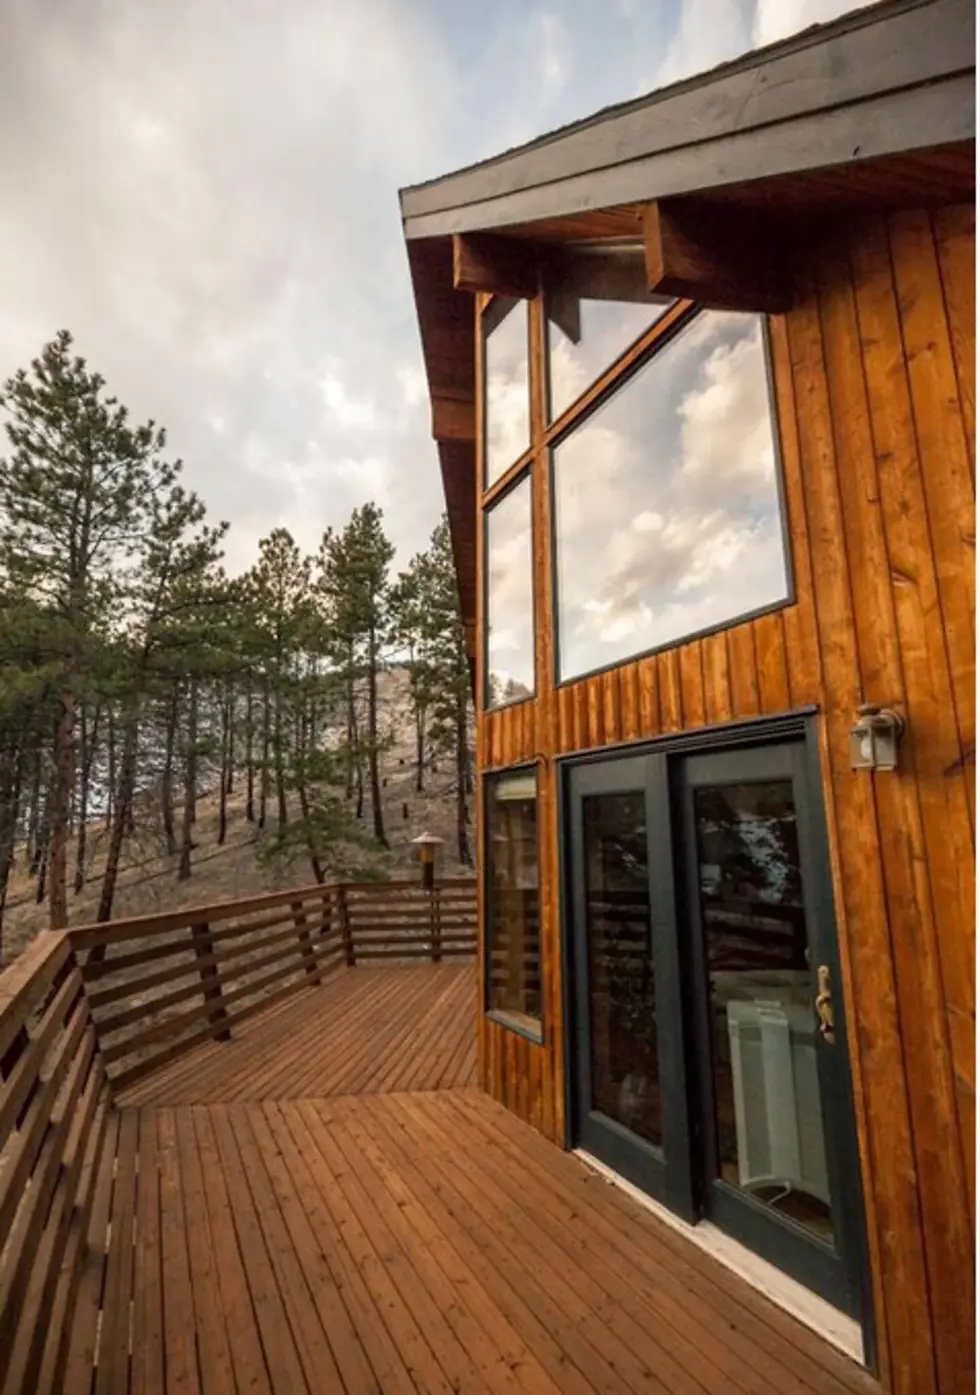
Mid to Late September: High-elevation aspen groves above 9,000 feet in Rocky Mountain National Park (48 miles from Boulder, roughly 90 minutes via US-36) hit peak gold. The Indian Peaks Wilderness and trails off Flagstaff Road, 1.5 miles from The Rusty Skillet Ranch, also show early color at this time.
Late September to Early October: Mid-elevation aspens between 7,000 and 9,000 feet reach peak. This is the prime window for Bear Canyon Trail (2.1 miles from The Rusty Skillet Ranch) and Eldorado Canyon State Park (8 miles away, roughly 20 minutes), where cottonwoods along the creek bottom add gold to the granite canyon walls.
Early to Mid-October: Lower foothills and canyon bottoms, including Boulder Creek Path (0.3 miles from the property), shift to autumn gold as cottonwoods and scrub oaks color up. Chautauqua Park, 2.8 miles from the property, offers the most iconic Flatirons-meets-fall-color views during this window.
This staggered elevation timing means a week-long Boulder foliage trip in late September to early October can hit multiple peak windows at different elevations, which is a genuine advantage over single-elevation destinations. For broader Colorado foliage planning, the Boulder hiking guide from the official tourism office includes seasonal notes on trail conditions and access, and is worth checking before finalizing your route.
If you want full outdoor adventures context beyond just foliage, The Rusty Skillet Ranch's blog covers outdoor adventures near Boulder with seasonal specifics that go well beyond what any foliage map shows.
Frequently Asked Questions About Fall Foliage Maps
How accurate is a fall foliage map?
A fall foliage map is a probability estimate based on historical averages, temperature models, and volunteer ground reports, not a live measurement of every forest. National maps are accurate within 1 to 2 weeks for broad regional timing but can miss hyper-local variation caused by elevation, species composition, and microclimate. Cross-referencing a national map with a state park or forest service report for your specific destination significantly improves accuracy.
How far in advance do foliage maps update?
Most national foliage maps like ExploreFall.com update daily during peak season based on on-the-ground reports, while prediction maps published in late summer use historical models that project 4 to 8 weeks ahead. The further out the prediction, the wider the margin of error. For trip planning, treat maps published more than 2 weeks before your arrival date as a rough guide, then refine your timing using daily updates in the final 10 to 14 days.
What is the best time to visit Boulder, Colorado for fall foliage?
The best window for fall foliage near Boulder, Colorado runs from late September through the first week of October. High-elevation aspen groves above 9,000 feet in Rocky Mountain National Park typically peak in mid-to-late September. Mid-elevation trails near Boulder, including Bear Canyon and Eldorado Canyon State Park, peak around late September to early October. The Boulder Creek corridor and Chautauqua area hold color through mid-October.
How long does peak foliage last in one location?
Peak foliage in any given location typically lasts 7 to 10 days. Strong wind events or early frost can compress this window to 3 to 5 days. The Near Peak stage, which precedes full peak by 3 to 5 days, often offers excellent color with significantly lighter crowds, making it a practical alternative to targeting the exact peak date.
What weather conditions produce the most vivid fall colors?
The most vivid fall colors result from cool nights in the 38 to 45 degrees Fahrenheit range combined with warm, sunny days. These conditions accelerate anthocyanin production in tree leaves, intensifying reds and purples in species like sugar maple and red maple. Drought reduces color vibrancy, and prolonged warm autumn temperatures delay and mute the display. According to SUNY ESF research, a lightly overcast day often makes colors appear more vivid than harsh direct sunlight.
Which fall foliage maps have mobile apps or push notifications?
As of 2026, dedicated mobile apps for foliage tracking are limited. The most reliable push notification option is the Minnesota DNR text service (text FALL to 66468), active during fall season. ExploreFall.com functions well on mobile browsers and is the most comprehensive national option for on-the-go use. State tourism boards in Vermont, New Hampshire, and Colorado publish weekly foliage email updates during September and October, which function as a low-tech push notification alternative.
Can you see international fall foliage on U.S.-based foliage maps?
Most U.S.-based fall foliage maps, including ExploreFall.com and the Smoky Mountains prediction map, cover only North America. Japan's koyo season (typically late October through mid-December, varying by region) has dedicated prediction resources from the Japan Meteorological Corporation. Canada's Quebec Laurentians and British Columbia can be tracked via provincial tourism sites. European foliage in destinations like Germany's Bavaria and Scotland's Highlands peaks in October, but no single international foliage map equivalent to U.S. national tools currently exists.
How to Make Your Trip Decision: A Quick-Reference Checklist
Planning a successful foliage trip comes down to combining the right tools at the right time rather than relying on a single source. Run through this checklist in the two weeks before your planned travel dates:
Check a national foliage map (ExploreFall.com or smokymountains.com) for your destination region. Note the current stage and the projected progression.
Cross-reference with a state or park-level report for your specific destination. State park websites and forest service reports are more precise than any national tool.
Check the 7-day weather forecast via the National Weather Service for overnight lows (targeting 38-45°F) and wind advisories.
Check elevation-specific timing for your planned hikes or drives. High-elevation and low-elevation areas in the same region can be 1 to 2 weeks apart.
Check recent visitor reports on trail forums or state park social media for on-the-ground confirmation of current conditions.
Download offline maps for any scenic routes or park roads where cell service is unreliable.
Target Near Peak arrival rather than exact peak if crowd avoidance matters to you. Color at Near Peak is excellent and the crowds are notably lighter.
For Colorado mountain foliage specifically, review Boulder travel itineraries that cover seasonal logistics, trail access details, and the most rewarding foliage routes in the Front Range for visitors unfamiliar with the area.
Plan Your Boulder Foliage Trip from the Right Home Base
Reading a fall color foliage map accurately comes down to combining multiple tools, understanding their limitations, and building flexibility into your timing. The map is the starting point, not the final answer. Peak foliage lasts 7 to 10 days, the near-peak window is often the better choice for avoiding crowds, and cross-referencing weather data with foliage stage predictions is the most underused planning technique available. In 2026, the best-performing combination remains a national map for regional context, a state or park-level report for on-the-ground specifics, and a wind advisory check for your actual travel dates.
If your foliage itinerary includes Colorado's Front Range, the timing and logistics are genuinely more favorable than most guides suggest: staggered elevation windows mean you can hit multiple peaks in a single week-long trip. Start high (Rocky Mountain National Park in late September), work your way down to mid-elevation trails, and finish in the Boulder foothills in early October.
For more on what to do once you arrive, the Things To Do In Boulder Colorado guide covers the full seasonal picture beyond just foliage trails.

After a day of chasing peak color on Boulder's trails, The Rusty Skillet Ranch puts you exactly where you want to be. The property sits 15 minutes from Boulder on 12 private acres, with Bear Canyon Trail 2.1 miles away and Rocky Mountain National Park under 90 minutes north. The handcrafted Japanese cedar soaking tub is especially worth it on a crisp late-September evening when the aspens are at their best. Check availability for your fall dates here.


Comments